Structural Design Risk Analysis
Aug 31, 2026
Monte Carlo Schedule Risk Analysis for a Structural Design Project in Sydney
A Worked Example
Every structural engineering practice in Sydney carries the same quiet exposure: a design programme quoted to a client at project kickoff, built from "typical" durations for each task, with no explicit account of geotechnical delays, certifier RFIs, or the client taking three weeks instead of three days to approve a concept. When the actual programme runs long, which it usually does, there's rarely any data to point to.
Just the original number, and the gap between it and reality.
This article walks through a complete, real Monte Carlo schedule risk simulation for a representative Sydney structural design commission: 25 activities, a 10-item risk register built around risks structural consultancies actually carry, and 50,000 simulation iterations. You'll see the full activity list, the risk register, the resulting S-curve and tornado diagram, and a proper interpretation of what the numbers mean for how you'd actually run the project.
The Sample Project:
Structural Design Package, Mixed-Use Building, Sydney
The scope modelled here is a typical mid-size structural design commission: concept design through to Construction Certificate documentation and certifier sign-off, for a mixed-use building in Sydney. It's deliberately representative rather than tied to one real project, so the method, not the specific numbers, is what's transferable to your own work.
Activity Table
Each activity has an optimistic (O), most likely (ML), and pessimistic (P) duration in working days, which is what feeds a triangular distribution in the simulation, the same three-point estimating method used in PMBOK-aligned schedule risk analysis.
| # | Activity | Predecessor(s) | O | ML | P |
|---|---|---|---|---|---|
| 1 | Project Initiation & Scope Confirmation | — | 2 | 3 | 5 |
| 2 | Review of Architectural Concept Drawings | 1 | 2 | 3 | 5 |
| 3 | Geotechnical Report Review | 1 | 3 | 5 | 8 |
| 4 | Site Survey Data Review | 1 | 2 | 3 | 5 |
| 5 | Preliminary Structural Concept & Framing Options | 2, 3, 4 | 5 | 8 | 12 |
| 6 | Structural Concept Coordination Meeting (Architect/Services) | 5 | 1 | 2 | 3 |
| 7 | Client Approval of Structural Concept | 6 | 3 | 5 | 10 |
| 8 | Preliminary Load Analysis (Dead/Live/Wind/Seismic) | 7 | 3 | 5 | 8 |
| 9 | Wind Load Assessment (AS/NZS 1170.2) | 8 | 3 | 4 | 6 |
| 10 | Seismic Load Assessment (AS 1170.4) | 8 | 2 | 3 | 5 |
| 11 | Foundation Design Options Analysis | 3, 8 | 4 | 6 | 10 |
| 12 | Structural Modelling (Analysis Software) | 9, 10, 11 | 6 | 10 | 15 |
| 13 | Model Review & Internal QA Check | 12 | 2 | 3 | 5 |
| 14 | Structural Framing Documentation (DD Stage) | 13 | 8 | 12 | 18 |
| 15 | Coordination with Services Engineers (Penetrations/Loadings) | 14 | 3 | 5 | 8 |
| 16 | Coordination with Architect (DD Stage) | 14 | 3 | 5 | 8 |
| 17 | Client Review of Design Development | 15, 16 | 3 | 5 | 9 |
| 18 | Design Development Revisions | 17 | 4 | 7 | 12 |
| 19 | Structural Certification / Compliance Check (NCC & AS Standards) | 18 | 3 | 5 | 8 |
| 20 | Construction Certificate (CC) Structural Documentation | 19 | 8 | 12 | 18 |
| 21 | Structural Specification Writing | 19 | 4 | 6 | 10 |
| 22 | Final QA / Peer Review of CC Documentation | 20, 21 | 3 | 4 | 6 |
| 23 | Issue for Construction (IFC) Drawings | 22 | 1 | 2 | 3 |
| 24 | Council / Certifier Submission & Assessment | 23 | 10 | 15 | 25 |
| 25 | Respond to Certifier RFIs & Final Sign-off | 24 | 3 | 6 | 12 |
O = Optimistic, ML = Most Likely, P = Pessimistic duration, in working days.
Risk Register
These are the risks that recur, in some form, across most structural design commissions in the Sydney market not exhaustive, but representative.
| ID | Risk | Probability | Impact (days) | Affects |
|---|---|---|---|---|
| R1 | Late or incomplete architectural drawings/coordination changes | 55% | 4–8 | 2, 14, 16 |
| R2 | Geotechnical delays or unexpected site conditions | 30% | 5–10 | 3, 11 |
| R3 | Client-driven design changes/scope creep | 45% | 5–12 | 7, 17, 18 |
| R4 | Wind/seismic code complexity requiring extended analysis (wind-exposed Sydney sites) | 25% | 3–7 | 9, 10 |
| R5 | Structural modelling errors requiring rework | 20% | 3–6 | 12, 13 |
| R6 | Peer review / QA issues requiring redesign | 30% | 3–8 | 13, 22 |
| R7 | Certifier/council RFIs on structural certification | 40% | 5–12 | 19, 24, 25 |
| R8 | Key engineering staff availability constraints | 20% | 2–5 | 12, 14, 20 |
| R9 | Services engineer coordination delays (penetrations/clashes) | 35% | 2–5 | 15 |
| R10 | Regulatory / NCC code changes mid-project | 10% | 5–15 | 8, 19 |
Probability = likelihood the risk occurs on a given project run. Impact = extra working days added to affected activities if it occurs.
Running the Simulation: 50,000 Iterations
Each of the 50,000 iterations: samples a random duration for every activity from its triangular distribution, independently rolls each risk against its probability to decide whether it occurs, adds its sampled impact to the activities it affects, then calculates the total project duration through the schedule's actual dependency logic the longest path through the network, not a simple sum of every task.
Results: P50 / P80 / P90
| Confidence Level | Project Duration |
|---|---|
| P50 (most likely) | 174 working days |
| P80 | 195 working days |
| P90 | 207 working days |
Across all 50,000 trials, outcomes ranged from 112 to 273 working days a wide spread, and exactly the kind of range a single-point estimate hides entirely.
The S-Curve
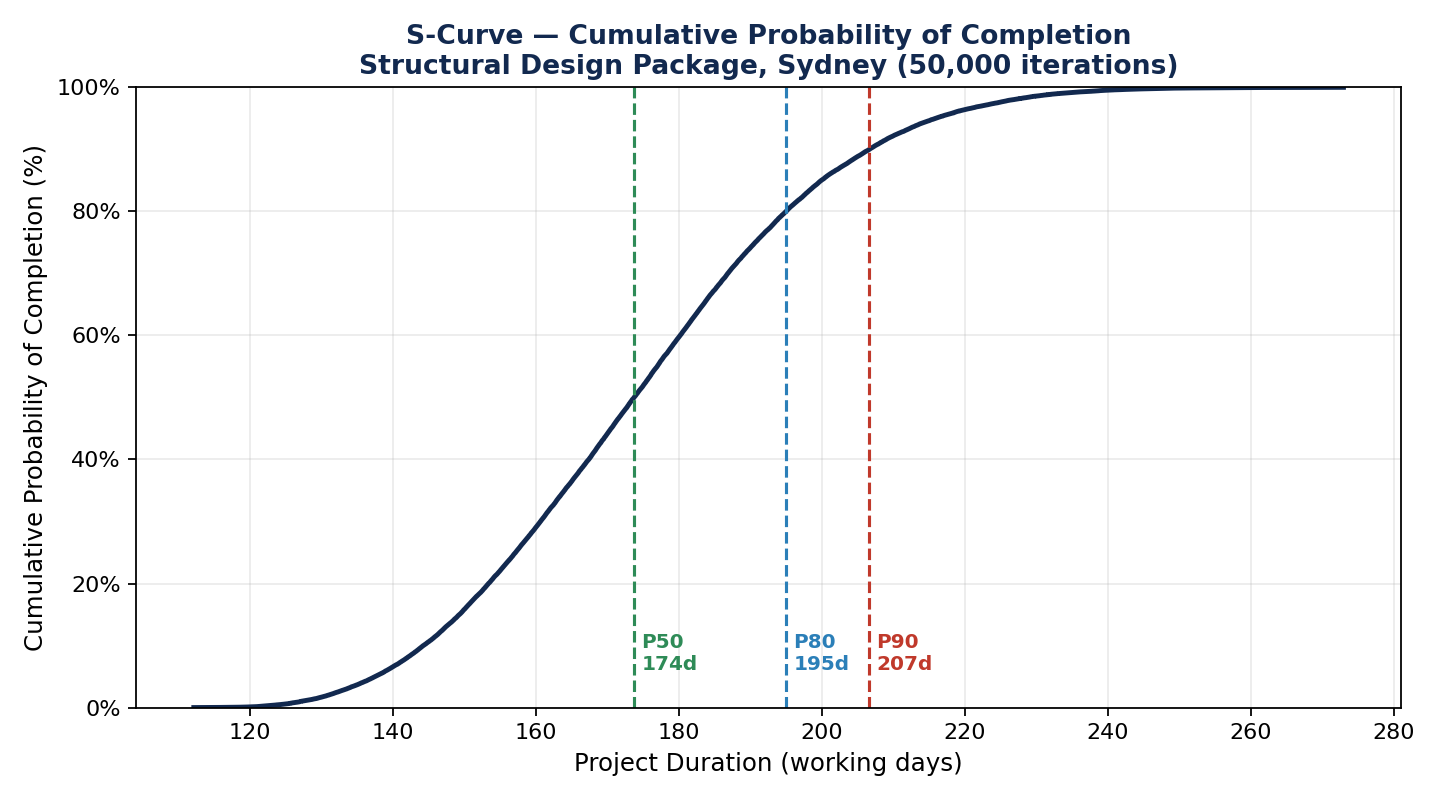
Read this as: at 174 working days, you have a coin-flip chance of being done. To be 80% confident, you need to plan for 195 days 21 days of schedule contingency beyond the "most likely" number most consultancies would quote a client without ever running this analysis.
The Tornado Diagram
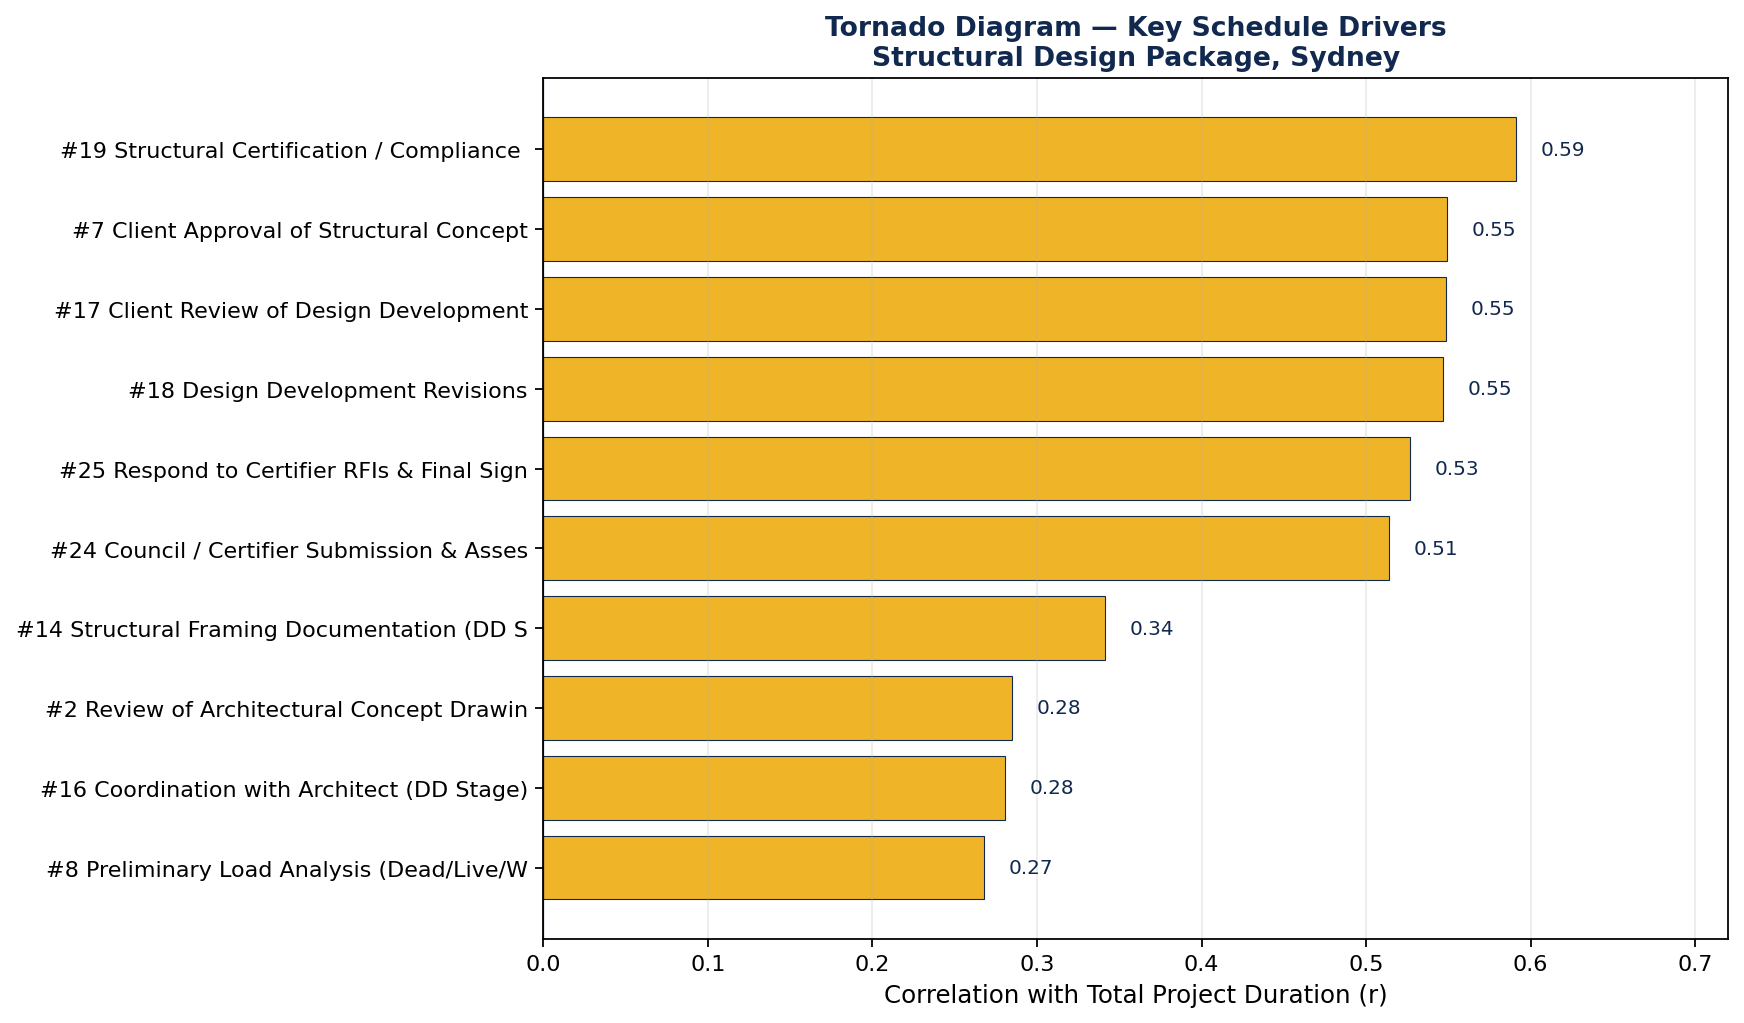
Each bar shows the correlation between that activity's simulated duration and the total project duration across all 50,000 trials the activities where schedule risk is genuinely concentrated, not just the ones that happen to be on the page.
Interpreting the Results
A few things stand out clearly from this simulation, and they're consistent with what shows up on real Sydney structural design projects:
The certification and client-approval stages dominate the risk profile, not the technical analysis stages. The strongest driver is Structural Certification / Compliance Check (r = 0.59), followed closely by Client Approval of Structural Concept, Client Review of Design Development, and Design Development Revisions (all r = 0.55). Certifier submission and RFI response round out the top six. In other words: the activities most worth protecting in your programme aren't the wind load assessment or the structural modelling they're the points where the project depends on someone outside your control a client, or a certifier.
Technical analysis activities carry comparatively little schedule risk. Wind and seismic load assessment, foundation design, and the structural modelling itself don't appear in the top ten drivers at all. This matches intuition: these are activities your own team directly controls, with well-understood durations. The uncertainty lives at the interfaces client decisions, external coordination, regulatory review not in the engineering itself.
A 21-day gap between P50 and P80 is a real, quantifiable contingency figure. Rather than padding every activity's duration with a vague buffer, this simulation tells you specifically how much schedule contingency is statistically justified, and via the tornado diagram exactly where mitigation effort will actually shorten that gap.
What This Means for How You Run the Project
- Commit to P80, not P50, when quoting a programme to a client. P50 is a coin flip by definition; treating it as a promise is how "we said 6 months" becomes "it's been 8" without anyone being able to explain why.
- Put mitigation effort into client and certifier touchpoints, not technical analysis. A tighter feedback loop with the client during concept and DD review, and early, proactive engagement with the certifier ahead of formal submission, will move the needle on schedule risk far more than optimising the structural modelling workflow.
- Track R7 (certifier RFIs) and R3 (client scope changes) specifically both sit behind multiple top-ten tornado drivers, meaning mitigating either one has compounding benefit across several activities at once.
- Re-run this analysis per project, not once generically; every commission has a different risk profile depending on site conditions, client type, and certifier.
Do This on Your Own Project
You don't need to take these numbers as generic; they're built from a representative example, not your specific project. AMEC College has published a free, browser-based Monte Carlo simulation tool that runs exactly this analysis on your own activity list and risk register no installation, no coding, no specialist software licence.
Try the free Monte Carlo Simulation tool →
If you want to understand the full method behind it how to properly structure a three-point activity estimate, build an AS/NZS ISO 31000-aligned risk register, and interpret P50/P80/P90 results with confidence our Predict Project Deadlines course covers it in 1.5 hours, self-paced, with a Certificate of Completion you can log toward your CPD record.
Frequently Asked Questions
Is this a real project, or a hypothetical example?
This is a representative, hypothetical structural design commission built to demonstrate the method, not an actual project. The activities, durations, and risks reflect patterns typical of Sydney structural design work, but every real project's specific numbers will differ.
Why does client approval carry more schedule risk than the engineering analysis?
Because the engineering activities in this model are performed and controlled entirely by the design team, with well-understood duration ranges, client and certifier touchpoints depend on a third party's response time, which is inherently harder to predict, and the simulation's tornado diagram makes that difference visible and quantifiable rather than anecdotal.
Can I use this method for other engineering disciplines, or just structural?
The method three-point activity estimating, a probability-weighted risk register, and Monte Carlo simulation of the schedule network applies equally to civil, geotechnical, mechanical, and electrical engineering design programmes. Only the specific activities and risks change.
Does completing the CPD course give me formal accreditation hours?
The course provides a Certificate of Completion documenting your study time, suitable for your own CPD record under self-managed CPD frameworks used by most Australian engineering and architecture bodies. Confirm your registration body's specific requirements if you're relying on it for mandatory renewal.