Summary
The utility and reliability of Pareto charts in project management have sparked considerable debate among practitioners and theorists alike. A Pareto chart, grounded in the Pareto Principle—often summarized as the 80/20 rule—posits that approximately 80% of problems arise from 20% of causes.
This analytical tool is widely employed to prioritize issues, streamline decision-making, and enhance focus on critical areas that can significantly influence project outcomes. Its relevance extends across various methodologies, particularly within Six Sigma frameworks, where it
aids teams in identifying and addressing the most impactful issues affecting project performance. Despite its widespread adoption, the effectiveness of Pareto charts is often scrutinized due to potential limitations and misinterpretations. Critics argue that these charts can oversimplify complex problems, leading teams to prioritize more frequent but less severe issues over critical, infrequent ones. Furthermore, the 80/20 rule does not universally apply, as variations in cause-effect distributions can occur, sometimes resulting in skewed data interpretations that hinder effective
problem-solving. Moreover, the reliance on quantitative data may restrict the applicability of Pareto analysis, as qualitative factors often play a crucial role in project success. This limitation calls for a more nuanced understanding and careful construction of Pareto charts to avoid overlooking essential issues. Consequently, while Pareto charts remain a valuable tool in project management, practitioners must exercise caution and apply best practices to enhance their trustworthiness and impact. In conclusion, the ongoing discourse around the usefulness and trustworthiness of Pareto charts reflects their significance in project management. By effectively leveraging data, recognizing limitations, and engaging in continuous improvement, project teams can optimize their resource allocation and decision-making processes, thereby enhancing overall project outcomes.
Conceptual Framework
The Pareto Chart, also known as the 80/20 Rule, serves as a foundational tool in project management for prioritizing issues and streamlining decision-making. The principle, named after Italian economist Vilfredo Pareto, asserts that approximately 80% of effects come from just 20% of the causes. This concept is instrumental in Six Sigma methodologies, where it helps identify the "vital few" issues that most significantly impact project outcomes, allowing teams to focus their efforts efficiently.
Understanding the Pareto Principle
The Pareto Principle posits that not all factors contributing to a problem hold equal weight. Instead, a small subset of issues is typically responsible for the majority of negative outcomes. This reality underscores the necessity of accurately constructing and interpreting Pareto charts, ensuring that each category is clearly defined and that data is appropriately quantified. To effectively apply the Pareto analysis, it is crucial to define the problem, identify contributing factors, gather relevant data, and calculate the frequency or impact of each factor.
Limitations and Misinterpretations
While the 80/20 Rule offers significant insights, it is essential to recognise its limitations. Critics argue that it oversimplifies complex scenarios, as the distribution of causes may not always neatly fit into the 80/20 framework; variations such as 70/30 or 60/40 can occur in practice. Moreover, misinterpretations can lead teams to overlook important issues outside the top 20% of causes, emphasizing the need for careful analysis and context-specific adjustments.
The Role of Data in Decision-Making
In the context of project management, the effectiveness of a Pareto chart is enhanced by supporting data. Gathering and quantifying data on project activities enables teams to make informed decisions, as it allows for an objective evaluation of which issues warrant prioritization. Project managers are encouraged to communicate findings and rationale to stakeholders to ensure alignment and understanding of prioritization strategies.
Applications in Project Management
The Pareto analysis is a valuable tool in project management, enabling project managers to identify and prioritize issues based on their impact on project outcomes. By applying the Pareto principle, which asserts that 80% of problems stem from 20% of causes, project teams can focus their efforts where they will yield the greatest benefits.
Problem Identification and Prioritization
One of the primary applications of Pareto analysis in project management is in the identification and prioritization of problems. Project managers can initiate this process by compiling a list of issues with input from team members, clients, and stakeholders, often drawing on customer feedback and helpdesk logs. After listing the problems, the next step involves determining the root causes using techniques like the Five Whys and Failure Mode and Effects Analysis (FMEA). By scoring each problem according to its importance—whether through financial impact or customer satisfaction metrics—teams can effectively rank the issues that need to be
addressed.
Visualization of Issues
To aid in communication and understanding among stakeholders, project managers frequently employ Pareto distribution charts. These charts visually represent the frequency and impact of issues, helping stakeholders grasp the relative importance of various tasks and the rationale behind prioritization decisions. This visualization is crucial during project meetings and discussions, ensuring that all participants are aligned on the focus areas.
Facilitating Resource Allocation
Pareto analysis is also instrumental in optimizing resource allocation. By isolating the most impactful problems, project managers can reallocate team members' efforts to ensure they are tackling the issues that will enhance overall productivity and project success. For instance, if a project manager identifies a bottleneck causing significant delays, they can swiftly adjust workflows or delegate tasks to resolve the issue without disrupting the entire project.
Continuous Improvement
Furthermore, the application of Pareto analysis supports a culture of continuous improvement within project teams. By regularly conducting this analysis, project managers can monitor project performance and adjust strategies based on emerging trends in problems and their root causes. This iterative approach helps teams stay agile and responsive to changing project dynamics, ultimately leading to improved project outcomes.
Advantages
The Pareto chart, based on the 80/20 principle, offers numerous advantages in project management, making it a valuable tool for decision-making and problem-solving.
Data-Driven Visualization
One of the primary benefits of Pareto charts is their ability to provide a data-driven visualization of the most frequent or costly quality issues within a project. This visual format allows stakeholders to quickly grasp complex data, facilitating discussions and consensus on where to focus improvement efforts. Even individuals with minimal statistical knowledge can interpret these charts easily, which enhances communication across teams and departments.
Efficient Resource Allocation
Pareto charts enable smarter resource allocation by highlighting the "vital few" problems that yield the most significant impact. By directing efforts towards the top 20% of issues, project managers can optimize the use of limited resources, ensuring that time and budget are spent where they will make the most difference. This approach not only boosts productivity but also minimizes waste associated with addressing less critical issues.
Enhanced Problem Identification
The Pareto analysis aids in identifying problems effectively by quantifying which issues have the most profound effects on the project. This clarity allows project managers to eliminate the noise from less significant problems and focus on those that, if resolved, could lead to substantial improvements in overall project performance.
Retrospective and Proactive Insights
These charts are useful for both retrospective analysis and proactive prevention of future issues. By periodically refreshing Pareto analyses, teams can detect new patterns and evaluate the progress made on past challenges, ensuring that the focus remains relevant and effective over time. This dynamic nature of Pareto charts makes them adaptable to various project management contexts
Benchmarking and Comparison
Additionally, Pareto charts allow for benchmarking against industry metrics and comparison of issue types across different projects or periods. This capability can provide organizations with insights into performance trends and help identify areas for improvement relative to industry standards.
Simplicity in Construction
Another significant advantage of Pareto charts is their simplicity in construction. They can be easily created using common spreadsheet programs, making them accessible for project teams without the need for specialized software. This ease of use encourages widespread adoption and implementation across various organizational levels.
Limitations and Criticisms
Despite their popularity and usefulness in project management, Pareto Charts exhibit several limitations and criticisms that can impact their effectiveness. Understanding these drawbacks is essential for project managers and decision-makers to avoid potential misdirections in their analysis and resource allocation.
Oversimplification of Data
One significant criticism of Pareto Charts is their tendency to oversimplify complex data. This simplification can lead to a loss of detail, where important nuances and relationships between various factors are overlooked. While the clarity of Pareto Charts can aid in decision-making, it can also result in misinterpretation of the underlying issues. For example, critical problems may be underestimated or neglected entirely, particularly in situations involving intricate interactions among multiple variables.
Focus on Frequency Over Severity
Pareto Charts prioritize issues based on frequency, potentially overshadowing the importance of more severe problems that occur less frequently. This approach may lead project managers to allocate resources towards minor issues that are more common, while significant but infrequent problems are neglected. Consequently, this skewed priority setting can result in the misallocation of resources and a focus on symptoms rather than addressing the root causes of substantial issues.
Limited Applicability to Qualitative Data
The utility of Pareto Charts is often limited to quantitative data, which may not be suitable for all types of analysis. The assumption that a small number of causes are responsible for the majority of problems, commonly known as the 80/20 rule, does not hold across all scenarios. This misapplication can lead to overgeneralization, where significant factors outside the presumed distribution are disregarded, thus affecting the overall decision-making process.
Difficulty in Identifying Complex Relationships
Another limitation is the challenge of identifying complex relationships among various factors. Pareto Charts typically emphasize straightforward data trends, which can obscure more complicated interdependencies that may be crucial to understanding the full scope of a problem. In dynamic environments where interactions between multiple variables play a critical role, relying solely on Pareto analysis may hinder effective problem resolution.
Skill and Experience Required
Effective use of Pareto Charts also necessitates a certain level of skill and experience. Misinterpretation of the 80/20 Rule can lead to misguided focus, as decision-makers might concentrate their efforts on the wrong issues, thereby neglecting important causes that fall outside the top 20%. Additionally, collecting and categorizing data accurately requires diligent management to avoid bias, which can further complicate the reliability of the insights drawn from the charts.
Best Practices
Utilizing Pareto Charts Effectively
When implementing Pareto charts in project management, following best practices can enhance their utility and trustworthiness.
Data Collection and Accuracy
Accurate data collection is critical for a reliable Pareto analysis. Project managers should gather a robust dataset that reflects the issues being analyzed over a relevant timeframe, such as the previous month or quarter. Employing diverse sources, including surveys, production logs, and CRM systems, can help ensure that the data is comprehensive and error-free.
Clear Categorization
It is essential to categorize the collected data logically and distinctly. Issues should be grouped into relevant categories to facilitate meaningful analysis. For example, if analyzing product defects, categorize them by type mechanical, electrical, etc., to clarify which areas require focus.
Create a Frequency Table
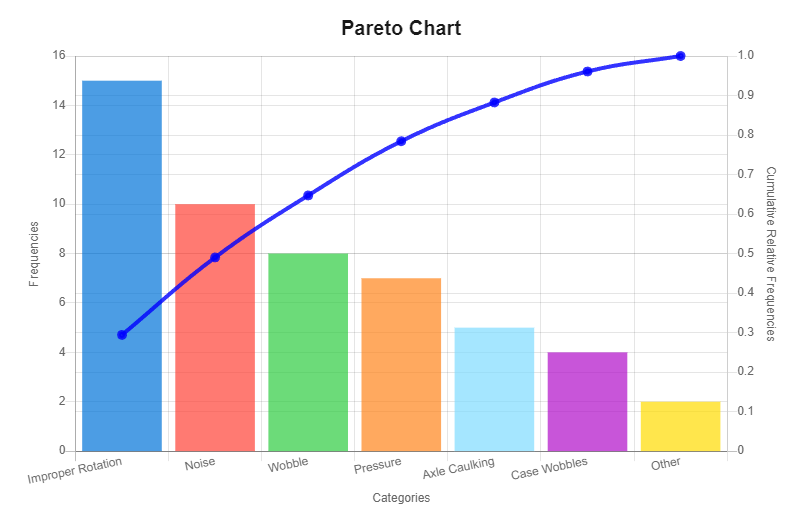
Before constructing a Pareto chart, a frequency table should be established. This table should list each category along with the corresponding count of occurrences, organized in descending order. This step simplifies the visualization process, making it easier to identify the most significant issues.
Visual Representation
When creating the chart, ensure that the horizontal bars are uniform in width and accurately labelled. The vertical axis should represent the frequency of issues, using rounded numbers that exceed the highest count to provide context. Adding cumulative counts as a line graph can further aid in visualizing the overall impact of the issues identified.
Focus on the 80/20 Rule
Leverage the Pareto principle (80/20 rule) to concentrate resources on the most impactful causes, which are often responsible for the majority of problems. This targeted approach can lead to more efficient problem-solving and resource allocation.
Regular Updates and Monitoring
Since Pareto charts represent a snapshot in time, it is vital to update them regularly to reflect changes in the process or project landscape. Continuous monitoring and iterative improvements will help maintain relevance and accuracy, fostering a culture of ongoing enhancement.
Communicate Findings
Lastly, effective communication of the results is crucial. Sharing insights from the Pareto chart with stakeholders can engage them in the problem-solving process and align efforts toward the most critical issues. Providing a clear visual representation promotes a shared understanding of the challenges at hand, facilitating collaboration and action. By adhering to these best practices, project managers can ensure that their use of
Pareto charts are both effective and reliable, ultimately enhancing decision-making and project outcomes.


Responses